
Solid surfaces in contact exert
a frictional force on each other when they are moved. In a similar way, the relative motion of
layers of liquid is restricted by friction.
The rate at which your blood flows through your
body, the rate at which oil flows along poipe lines and the rate at which dust particles fall
through the air are all affected by the viscosity of the fluid (gas or liquid).
The frictional
forces within a fluid give rise to a property known as the viscosity of the liquid. The greater the
viscosity the less easy it is for the fluid to flow and the stickier it feels. The viscosity of a liquid
also affects how easily solids can move through it - try and imagine the difference between
swimming in water and in treacle!
Consider the flow of liquid down a pipe as shown in
the following diagram.
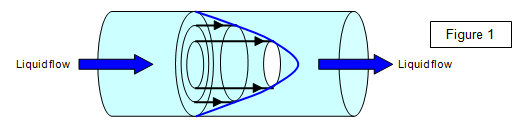
The liquid
will be moving from left to right due to the pressure difference between the ends of the tube.
However because the friction between the fluid and the walls of the tube is greater than
between two adjacent layers of liquid the liquid in the centre of the pipe will be travelling faster
than that at the edges.
Imagine that the liquid is moving in layers, rather like the cards in a
pack, and assume that no one layer crosses another layer. The frictional forces within the liquid
act between one layer and another. Such motion is called laminar flow. The velocity of particles
at a given distance from the centre of motion is constant. However if the layers do intermix we
will get turbulent flow.
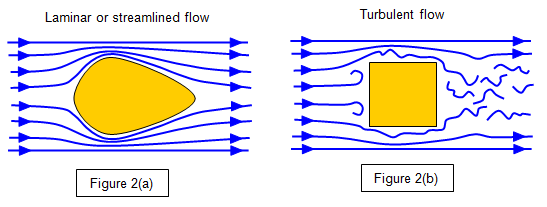
A streamIine is a curve whose tangent always lies along the direction of motion of the fluid at that point. The streamlines never cross and in laminar flow they do not alter with time. (Figure 2(a)) but this is not the case with turbulent flow (Figure 2(b)). Clearly it is important for a vehicle moving through a fluid that the flow of the fluid around it is laminar so that the drag on it may be reduced to a minimum.
Alternatively we could consider a stationary fluid and a moving tube. It is then
clear that as the tube moves through the fluid it will drag some fluid along with it, while the fluid
at the centre of the tube will lag behind. There is therefore a larger relative velocity between the
tube and the central fluid than there is between the tube and the fluid in contact with it. This
change in velocity with distance is called a velocity gradient.
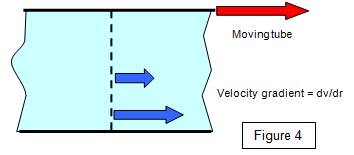
and is therefore very similar to the
shear modulus for a solid. The units of the coefficient of viscosity are Nsm-2, kgm-1s-1 or Pas,
and it has dimensions ML-1T-1.
The values of some coefficients of viscosity are given in the
table below. Since viscosity varies with temperature they are all given for 20oC.
| Fluid | Viscosity (Pas) | Fluid | Viscosity (Pas) | |
| Air | 1.8x10⁻⁵ | Water | 1.0x10³ | |
| Glycerol | 8.3x10⁻¹ | Golden syrup | 1.0x10² | |
| Castor oil | 2.42 | Mercury | 1.5x10⁻³ | |
| Blood | 3 - 4x10⁻³ |
| Pitch | 5x10¹⁰ Pas at 273 K | Water | 0.0018 Pas at 273 K | |
| 1.1x101 Pas at 373 K | 0.0010 Pas at 293 K | |||
| An oil | 5.3 Pas at 273 K | 0.0007 Pas at 310 K | ||
| 0.99 Pas at 293 K | ||||
| 0.23 Pas at 313 K |