Heat loss from polystyrene cups SAMPLE ACCOUNT
AIM OF
THE EXPERIMENT
(IMPORTANT) In my
practical coursework I have decided to investigate how the loss of heat from a polystyrene
cup is affected by the thickness of the sides of the cup.
WHAT I AM
GOING TO DO
(IMPORTANT) To do this I will
collect a polystyrene cup, fill it with hot water and measure the drop in temperature of the
water during a set time.
I will then repeat the experiment but put another cup round the
first to double the thickness of the sides. I will repeat the temperature measurements. I will
go on doing this for up to a thickness of eight cups.
WHAT AM I GOING
TO CHANGE (my variable)
(IMPORTANT)
The thickness of the cup sides (in this experiment there is only one
variable)
WHAT AM I GOING TO KEEP CONSTANT
(IMPORTANT)The starting temperature of the hot water and
the time of cooling.
SAFETY
(you should
always mention this somewhere) I will be heating the water with a bunsen
burner so I will wear goggles for this. I will also be careful when pouring the hot water into the
cups.
PREDICTION
(you may not always need to
do this) I predict that as the thickness of the cup sides gets bigger the
temperature of water in the cup will not go down so much.
PRELIMINARY
EXPERIMENT
(this may not be needed) I will
do a preliminary experiment to get a rough idea of how long I should time for. This is
necessary because if the time is too short there will not be enough cooling to measure and if
the time is too long I may not be able to finish the
experiment.
SCIENTIFIC THEORY SAMPLE
(there are lots of different levels possible here) The bigger the
temperature difference between the water and room temperature the quicker the temperature
of the water will go down. This is why I am going to always start timing when the hot water is
at the same temperature. I will try to start at 80oC each time.
The thicker the wall of
the cups the more difficult it will be for heat to travel through it. So by putting one cup inside
another I will be making the wall thicker. I would expect that it would be twice as difficult for
the heat to travel through two cup walls than through one and so for two cups the
temperature should drop twice as slowly. This means that in 5 minutes the drop in
temperature for two cups will be half what it was for one cup.
I have looked up
some advanced theory and I have found that for a particular material the temperature drop is
inversely proportional to the thickness of the walls. In other words double the thickness and
you will halve the drop, three times the thickness and you will reduce the drop to one
third.
However I have got to remember that the water is not surrounded by polystyrene.
The top of the water is open to the air so I am going to make a paper lid to fit over the cups.
This lid will always be the same thickness and so my results may not quite agree with my
theory.
WHAT I WILL NEED
(important if other people
are to check your experiment)Eight polystyrene cups of the same
size
Paper to make a lid
Scissors
Thermometer
Bunsen, tripod, beaker, heat
resistant mat, gauze, cloth for holding beaker
Safety goggles
Stop
watch
DIAGRAM OF MY APPARATUS
(notice
that it is clearly labelled)
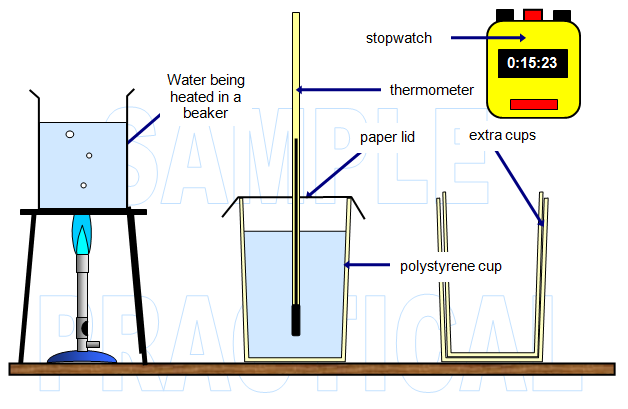
Warning and suggestion: only draw your diagrams
using the computer if you are really sure that you can make them look the way that you want.
Like typing the account it can waste you a lot of time and it may not turn out right in the
end.
WHAT I DID
(A simple account of the
experiment) SAMPLE
I heated the water in a beaker to nearly boiling then I
careful poured it into one of the cups. I covered it with the paper lid and put the thermometer
in. When the temperature had fallen to 80
oC I started the stop watch. After 5 minutes I took
the reading of the stop watch.
I recorded the start and end temperatures in a table and
then worked out the drop in temperature.
I repeated the same procedure for two cups,
then three up to eight. Each time putting the cups one inside the other.
Before taking
each thermometer reading I stirred the water gently to be sure that it was all at the same
temperature. (You should always do this).
I repeated some of the results ads a
check.
(This is a very good idea – sometimes you can plot the graph before you repeat
results. Looking at the trend line on the graph will show you which ones to do
again).
OBSERVATIONS AND RESULTS SAMPLE
(This
section has not been completely filled it. It is shown as an example of how you can present a
good results table)
The temperature was taken after five minutes
The same starting temperature was
used each time.
The mass of water in the cup was the same each time (350
g)
A note on results tables
Each column clearly headed with the quantity and the
right units – in this case
oC.
Numbers written in neatly
Table ruled out – yes, using a
ruler!
Record all your results – if you average the readings still record both
values.
Repeated results SAMPLE
I check a number of the results to
make sure that I got an accurate graph.
One of them (for 5 cups) in the first trial did not
fit the line.
(We have just guessed that one of them is out. We call this an anomalous
result and it should be checked).
CALCULATIONS, ANALYSIS AND CONCLUSIONS - SAMPLE
I worked
out the temperature drop for each experiment and plotted a graph to show the change. The
graph shows the temperature drop on the Y axis and the number of cups on the X
axis.
You can see that my prediction was about right, the line goes down which
shows a smaller drop in temperature for more cups. However the drop does not quite halve
when I doubled the number of cups. This is due to some inaccuracy in my readings, loss of
heat from the lid and a change in the temperature of the room.
CONCLUSION
(always put one it so that it can be seen clearly)
The temperature drop is less when the
thickness of the walls of the cups is bigger. Putting one cup inside the other showed this. The
drop in temperature almost halves when the thickness of the cup walls is
doubled.
This agrees with my theory (see planning section). (you don't need to write
out the theory twice)
 GRAPH
GRAPHGraphs must have:
a
title
labelled axes with a scales that the final graph fills the graph paper
correctly
plotted points
a best fit line – sometimes called a trend line
you should plot all the
points, even the ones that do not seem to fit your line
they may not always need to show
the zero point on either axis
try and make them fill the graph
paper
EVALUATION, IMPROVEMENTS AND ALTERNATIVES
SAMPLE
I think that the experiment went fairly well and that the results give a firm
conclusion to support my prediction. I found one anomalous point on the graph but to check
this I repeated that result (as well as one or two others).
To improve my experiment I
would take the following precautions:
I may need to shield the cups and thermometer to
avoid draughts.
What about the air gaps between the polystyrene cups?
Could I
have used polystyrene lids?
I would try to use a more accurate
thermometer
Alternative experiments could be done with other cups and different
starting temperatures.