
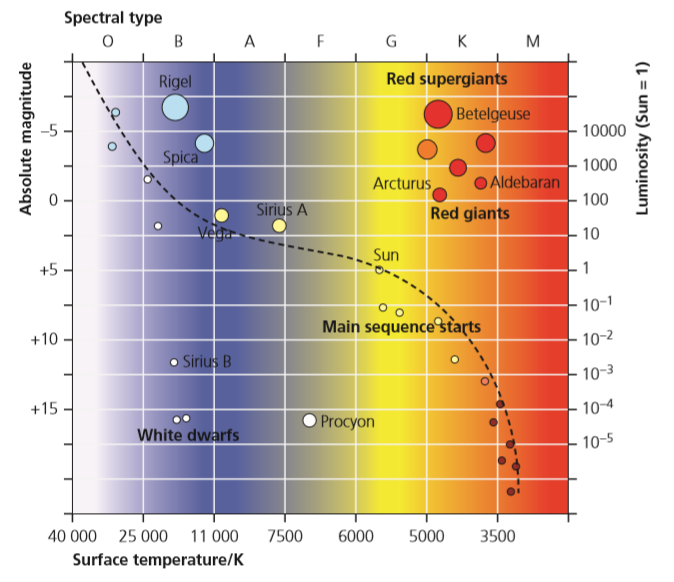
Early in the twentieth century (around 1910) two astronomers, Ejnar Hertzsprung and Henry Russell first had the idea of plotting the absolute magnitude of a star against its spectral type. This type of diagram is known as a Hertzsprung-Russell diagram. Since the original diagram was produced other quantities, the surface temperature and the luminosity compared with the Sun, have been added to give a version like that shown here. It is a very useful way to display the properties of a star.
Hot bright stars are towards the top left of the diagram while cool and dim stars are towards the bottom right. Some stars, like the supergiants are quite cool but because of their enormous size they are in the top right of the diagram. On the other hand white dwarfs are hot small stars and so appear to the bottom left.
There is a band of stars that runs from the top left to the bottom right (shown by the dotted line in the diagram) and this is called the Main Sequence. Stars that lie in this area are called main sequence stars – the Sun is a main sequence star. In a way stars that lie on the main sequence are ‘normal’ stars while those that lie to one side or other of this area are ‘unusual’ stars – these stars such as white dwarfs, red giants and supergiants. Notice that supergiant stars can be either hot like Spica or cool like Betelgeuse. About 90% of the stars in our region of the galaxy are main sequence stars, 10% are white dwarfs and 1% are red giants or supergiants.